A more quantitative approach to rugby union
REC2020 - 75 tries in 12 matches
Every time Italy are thrashed in the Six Nations, the impatient fans cast a spell of relegation on the serial Wooden Spoon winners. For many of them that’s the only moment in the rugby season when the Rugby Europe Championship is conjured. The REC, however, is like the Six Nations in reverse, with one side dominating the competition. Even though the quality of the European second division has vastly improved over the recent years, the gap between the Lelos and other contestants remains unbridged. How huge is this distance? A simple graph plotting tries scored against tries conceded depicts it best.

Interestingly enough, the way Georgia have scored their 28 tries this year hasn’t significantly differed from the competition. More than a half of all try-scoring platforms in the REC 2020 began at line-out and so have scored the Lelos. Statistics quantifies the ‘no-difference’ in the share of tries scored after attacking line-out at a fairly large probability (61%). It doesn’t necessarily mean all teams scored in the same manner. So how did they score?

Time of Controlled Possessions and Platforms
Nick Hill estimates for T1 countries show that 0-to-3-phase attacking platforms account for nearly 50% of tries scored. Regrettably, I never focused on phases. Instead, I timed all REC2020 possessions and platforms. After all, the time of controlled possession, or if you will the ball-in-hand time, serves a similar purpose.
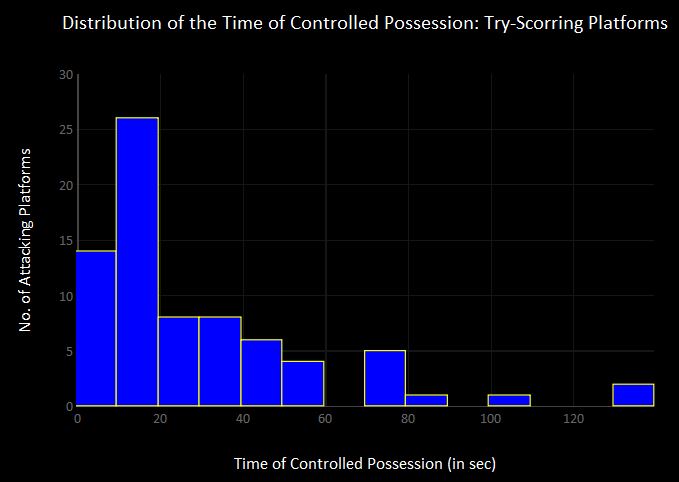
The median length of a try-scoring platform was 18 seconds. That’s probably slightly longer than the time of a zero-ruck platform, which have led to 30% of tries in 6N and nearly 40% of tries in the Rugby Championship (again, I’m referring to Nick’s data). The right tail of the distribution is longer and reaches beyond 2 minutes. Dropping the statistical jargon, it means that that a try scored/conceded is more likely when the platforms are shorter, and that once the median time is reached the probability of scoring decreases considerably.
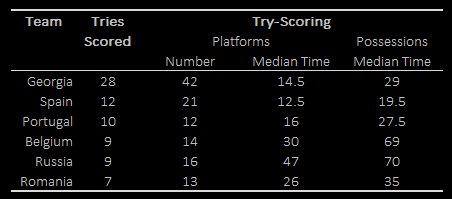
The three top-scoring REC countries recorded a much lower median time than the rest of the competition. The graph below presents the median time (horizontal axis) related to the median for Georgia. Spain and Portugal are very close the Lelos. On the other extreme, the Bears try-scoring platforms lasted on average 47 seconds.
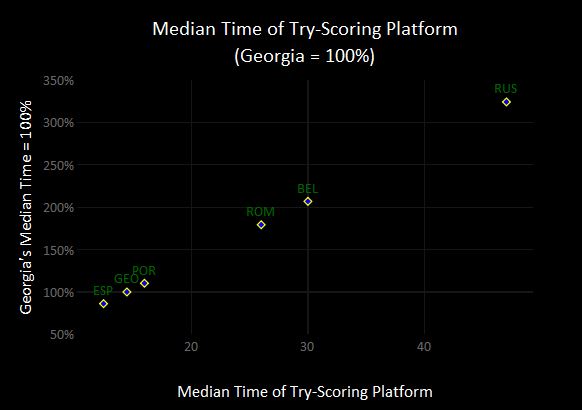
The comparison might offer an additional insight into the quality of Georgian backs. The Lelos attack is much more than just bashing through the middle. Of course, they’re renown for a dominant scrum for a very good reason, but Georgia combine strength with quickness. Spain and newly-promoted (but not new to the Championship Series) Portugal have also implemented a fast-paced attack with a very strong width game. It’s borne fruit for Iberian rugby, even though both teams failed to win against otherwise disappointing sides.
Talking about disappointment and bashing up the middle, the Oaks bringing up the rear is something I didn’t expect. Symptomatic for Romania, the longest possession in REC2020 resulted in a jackaled ball. 3 platforms for the total of 4 min 51 sec (172s, 61s, 58s), started and finished in the Opp22. Not surprisingly, the ball didn't travel much across the horizontal channels. The infamous possession no. 18 against Portugal in numbers: 38 phases, 40 carries, 38 rucks. Of 30 passes, 24 happened to be ground passes. A sequence of 2 consecutive passes occurred just once. The chance for the ball to stay in the left-mid channel was equal to 89% (same for left 15m channel). Not much of a width game, was it? The Oaks can play fast and very effectively, though. They had levelled-up against Georgia for 60 minutes (in all honesty they conceded 4 tries in the final quarter). They outplayed the Lions. They will come back strong.
The Place
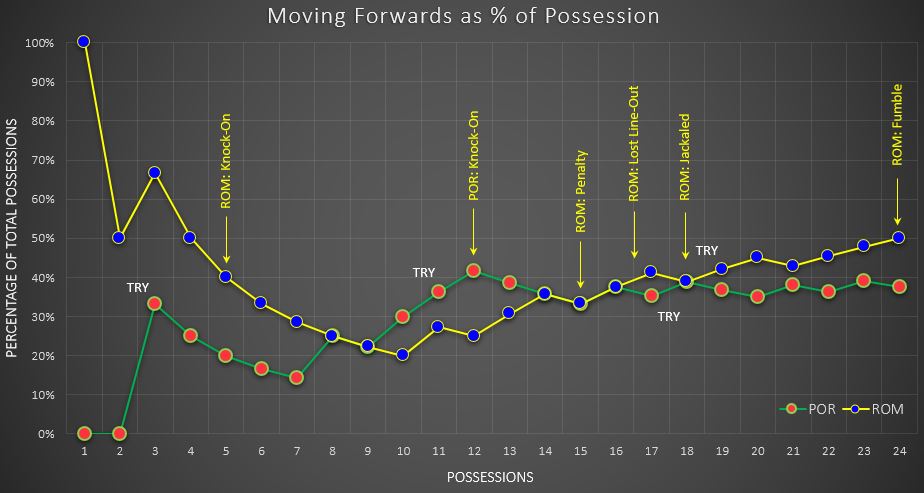
Meanwhile, the Romanian attacking style has resulted in the lowest number of scored tries in REC2020. Equally remarkable was the place where their try-scoring platforms started – the frequency for the Opp22 was equal to 86%. The zone percentage might not always indicate a specific attacking style, yet it works rather well for the REC2020 polar opposites. The graph below shows the cumulative percentages for Portugal and Romania. The blue line remains flat and explodes arriving in the red zone. For Portugal, the percentages are much more evenly distributed across the zones.

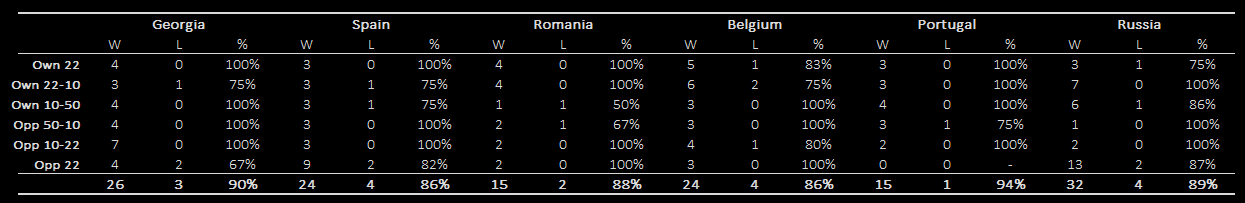
The graph also offers another insight into the Wolves’ successful adaption to the requirements of modern game. Using speed to their advantage, Portugal were more clinical than the opponents. In the direct challenge on the sunny afternoon in Caldas da Rainha, the Oaks controlled the ball for 20 minutes and 36 seconds, moving forwards in 12 of their 24 possessions. The same metrics for Portugal were significantly smaller – 8:07 and 38% – yet os Lobos managed to scored three tries. The lack of a clinical finish costed Romania dearly. The 32. minute (see possession 11 below) marked a turning point for the Oaks, as they started consequently gaining territory. They failed, however, putting points on the scoreboard, finishing 5 possessions in the Opp22 without scoring.
For other teams, the place where the try-scoring platforms were initiated was less symptomatic. Exactly 50% of scores started in the red zone. From the defensive standpoint, discipline was essential as the lion’s share of scores began at line-out after kick in touch.
Line-Out
Nick Hill’s database for 6N countries indicates that the highest percentage of scores is accounted for the attacking line-out. A similar tendency was present in REC2020. What is intriguing, the percentage itself was much higher as the REC sides scored 40 tries (53%) from line-out. Is there any analogy to a specific T1 country? It appeared that Ireland recorded a similar percentage (58%) of scores in 2016. One possible reason why the line-out is an ‘over-represented’ source of tries in the REC tournament is the defence. In the year 2016, Ireland,
England, and
New Zealand scored 44 out of 142 tries (22%, 33%, and 35% respectively) after turning the ball over. With slower line speed, the T2 defences are less effective at forcing try-scoring turnovers. Another reason for line-out’s ‘over-representation’ is the small impact of scrum. For the three T1 countries, the attacking scrum accounted for 17% of scored tries. The share for REC2020 was merely 8%.
The vast majority of line-out tries were scored in the Opp22 zone. Not surprisingly, powerful Georgian forwards physically dominated the opponents in the close-range line-outs. The Lelos turned more than a half of attacking line-outs in the Opp22 into tries. Other countries were much less effective in this aspect – 72 attacking line-outs in the red zone led to 15 tries.
Georgia’s efficacy originates from strength and versatility. Here’s an example of the former.

The latter is a quality conventional wisdom rarely attributed to the Lelos. Most teams prioritise stopping the Georgian maul. If too many defenders commit only to pushing, the Lelos may explore other options as they did against Spain. Gauthier Gibouin joins the maul, expecting the Georgian N8 to do the same. This is what the Lelos did in their second possession, when they wedged through the defenders. But now the ball is in the hands of Beka Gorgadze (N8), who passes it to Shalva Mamukashvili before crashing into the Spanish scrum half. The hooker beats one defender and scores. All that took just 6 seconds.

I already mentioned that the Wolves had scored only once starting the platform in the Opp22. I also mentioned that they employed speed to their advantage and thus Portugal were able to turn 5 line-outs into tries. Below is an example of how los Lobos attacked the 13 channel after a series of 5 passes and a grubber kick. Interestingly, they attacked this channel in a similar manner twice, touching down on both occasions.

Kick Return
The second highest source of scores in REC2020 has been the kick return (19%). For a tournament with a very limited number of kicks, the percentage is impressive. It’s even more impressive when we realise that when teams surrender possession, they opt to punt (161) rather than to box-kick (83). The majority of European T2 scrum-halves executes box-kicks well, meeting T1 standards for hang time, distance, and accuracy. The frequency of long-range kicks might therefore suggest a risk-averting game plan – kicking deep into the receiving team territory mitigates the risk of successful kick return. But as the portfolio choice theory tells us, there is a trade-off between risk and reward, and so a lower-risk long-range punt substantially reduces the chance for re-gathering the ball or even challenging the receiver. As I couldn’t find the punt-to-box ratio for the 6N sides, I compared the REC results with the first four rounds of Premiership. The red dashed line in the graph below depicts the 1-to-1 ratio. The majority of PremRugby teams are located above it. All of them are also located much higher than the REC countries, meaning the English teams surrender possession much often. For the sake of comparison, I added Japan’s score after 3 rounds of Pacific Nations Cup 2019. Set aside the total number of kicks, the punt-to-box ratio for the Brave Blossoms is very similar to those observed in the Championship series.

To my surprise, more tries have been scored after fielding punts (5) than box-kicks (2). The place where these punts have been received – three in Opp50-10, other two in Own10-50 and Own22-10 – suggests that the kicks weren’t long. Indeed, 59 of 161 punts (44%) have been fielded in the space bounded by the dashed 10-metre lines. Perhaps box-kicks with satisfactory range and hangtime offer a less risky alternative after all?
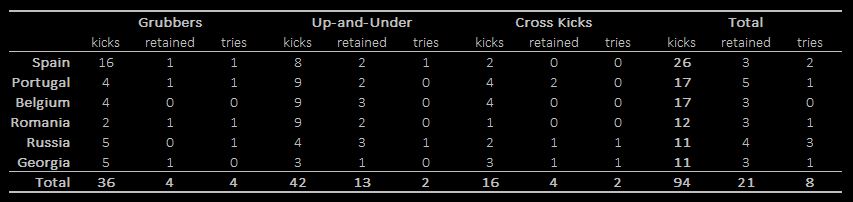
It may seem even more surprising that 5 tries have been scored after receiving kicks for disruption. It may if it wasn’t for Georgia penalising Belgium for a kick-happy game plan. The Lelos scored 4 tries after intercepting two cross-kicks and two up-and-unders. The learning outcome for the Black Devils: cross-field kick performed in the own red zone against well-set defenders is altogether not a good idea…
To the best of my knowledge try-scoring pattern in the REC tournament hasn’t been studied, thus making it impossible to say if a kick return has always been a large source of scores. Considering the fact that half of all tries scored after fielding kicks was conceded by Belgium, it’s quite possible that this year’s result is an outlier rather than a regular occurrence.
Turnovers
Similarly to the kick return, exactly half of all tries scored after turning the ball over was recorded by one team. The Spanish defence has been remarkably effective – of 10 steals, 5 have been turned into tries. That, by the way, was not the only aspect of defence the Lions have been efficient at. They have recorded the highest percentage of stopping the opponents, not allowing for territory gain in 74 out of 121 opponents’ attacking possessions. They also have conceded the second-smallest number of tries.
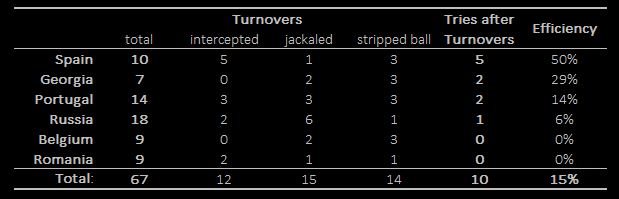
Evidently, turnovers produced the fastest-scored tries in the tournament. The average time elapsed between a turnover and a try was 16 seconds. That’s 12 seconds shorter than the average length of a try-scoring platform initiated by line-out or 26 seconds by a kick return.
Scrum
I have already mentioned the scrum’s small contribution to scoring tries. Merely 6 tries have been scored after scrums (incl. one uncontested scrum won by Georgia against Belgium). The number becomes even more puzzling after inspecting the zone frequencies – 37 scrums have been set in the Opp22, 84% of them have been won by the attacking side.
Russia led the competition, scoring twice against Romania and once against Portugal. All their try-scoring platforms began in the Opp22. Interestingly, the tries scored against Romania required multiple-phase platforms lasting 52 and 74 seconds.
Kicks for Disruption
There’s one immensely important aspect of the try-scoring pattern that is not related to how the platform started but rather to how it evolved. Kicks for disruption call for special attention. Why? Any Tier 2 side dreaming of joining the elite needs to incorporate cross kicks, grubbers, and up-and-unders to their attacking repertoire. Just like the Brave Blossoms have.

In three matches of the Pacific Nations Cup 2019, Japan have kicked 20 times, retaining 8 kicks. Meanwhile in Europe, only Spain have kicked with similar frequency, though their retention rate has only reached 11.5%. Russia have achieved a retention rate only 4 pp lower than Japan, but averaged 2.75 kicks per game. I’m not suggesting that kicking is the only aspect the European T2 nations should adopt from the Brave Blossoms, but the aggregates depict the difference in attacking strategies rather well. The REC sides recorded 3.9 kicks per match, the average for Japan was 6.7. Japan retained possession after 40% of disruption kicks, the REC sides after 22%. Last but not least, Japan have successfully used the cross-field kick. On average, the Brave Blossoms cross-kicked 4 times per game, whilst the average for REC2020 was 0.7.
 * * *
* * *
The winning bonus point in Rugby Europe is awarded for scoring at least 3 more tries than the opponent. Therefore, the losing side can capitalise from scoring tries in two distinct ways, not only by being awarded the losing bonus point, but also by denying the winning team the bonus point. Whether the REC nations take full advantage of this system or it’s just a coincidence, the average tries per match is astonishingly high (6.25). Even after excluding Georgia, the average is still above 5. That’s probably the best advertisement for the tournament.
* * *
If you’d like to compare the REC202 with the way T1 countries score their tries, here are some interesting articles
Murray Kinsella on the
All Blacks 2016,
Ireland 2016, and Ireland under
Joe Schmidt's first 22 matches
Henry Mander on
RWC 2011
Charlie Morgan on
England 2016