A more quantitative approach to rugby union
Thanks to
@RugbyInsideLine , the tackle completion rate (TCR) is the rugby metric of the hour. Ironically, it’s the ambivalence towards TCR’s informative potential that’s revived
the discussion. On one the hand TCR has been used to illustrate the Tigers’ poor performance against Exeter. No-one expects a team to win if the completion rate is merely 72%. No-one
expects a team to win if the team finishes the round with the league-lowest TCR. On the other hand, TCR is just a number. And numbers, even if they’re real, may have an imaginary
interpretation.
Context is Everything
Alex Shaw and The Dead Ball Area are right. Stripped of their context, meticulously collected statistics are as useful as randomly generated sequences. It’s the context that makes them useful. Time and place
are critical. A tackle missed in the own 22 may have much more grievous consequences than a tackle missed in opposition 22. Equally damaging consequences may have a
missed tackle resulting in a clean break. Interestingly enough, completed tackles can lead to clean breaks as well. Two weeks ago (3. September) in a Premiership Rugby Shield match,
Gloucester United accomplished 4 CBs after missed tackles. Interestingly enough, Gloucester also completed 4 clean breaks after Quins' successful solo tackles. The completed tackles
resulted in offloads; tacklers can't be blamed for allowing offloads.
Finally, defences may respond differently to TCR, regarding whether the system is drifting or blitzing. An intuitive assumption is that the blitz defence is more vulnerable to missed
tackles. But even that is not always clear. Blitzing defenders always keep their outside arm free and force the ball carrier to the inside because this is where the help comes from.
(If safeties, linebackers and defensive ends read it, they must finally feel very much at home). A missed tackle is acceptable as long as the ball carrier is forced to make a cut to
the inside. Here’s what
Mike Tindall said about Andy Farrel: “As long as they’re getting up and in people’s faces they don’t count them
as missed tackles, because they’re doing their job by forcing [the opposing players] to the inside.”
Large Numbers Make the Context
Official statistics mention neither the place where the missed tackle occurred nor its result. The context is missing. Are the official stats any good, then? Yes, they are, but only if
there’s enough observation to make an inference. Individual experiment offers no valuable insight into an inquiry of a much more general nature. There can be only a weak relationship
between TCR and winning, or even
no correlation whatsoever. The increasing number of observations produces
its own context. The law of large numbers is at work. There is a pattern hidden in the data. The pattern emerges if an experiment, or in this case a rugby match, is repeated frequently.
For instance, one Premiership round produces 12 additional observations, one season accounts for 264 observations. After discarding draws, the sample size for the 2017/18 season
contained 262 observations. That’s large enough to apply statistical modelling.
TCR and Winning Probability
To depict the impact of TCR on winning/losing probability I’ve estimated a logit model for a binary choice explaining variable (match won = 1, match lost = 0). I’ve limited the explanatory
variables to four defensive metrics: TCR, conceded metres per carry, (own) defenders beaten per (opp) carry, and turnovers forced per (opp) carry. Why relate conceded metres, defenders beaten,
and forced turnovers to the number of opposing team’s carries? I first came across this idea after reading possession and territory stats from the Exeter-Newcastle semi-final match last season.
In the first half, the Chiefs managed to control the possession for 92%, leaving the Falcons virtually no chance to score. This remarkable percentage called for an adjustment, but examples of
larger ball possession combined with a defeat flourished. Hence, I experimented with the number of carries as a more reliable proxy for ball possession.
Even though the model did not perform particularly well, predictions based on it were surprisingly accurate. The model correctly predicted 64.9% of wins and 65.6% of loses. TCR turned out to
be highly significant, yet its impact on the probability of winning was small. Let’s simulate the probability of winning for the season-lowest and season-highest TCR. To do it, first assume
that the other defensive metrics are at their average levels. The results are in line with the sceptics as there’s only a 13-percentage point difference in probability of winning. In other words,
if your team performs at the league’s average but completes only 63% of tackles, the probability of winning is 42%. If your team performs at the league’s average but completes the astonishing 98%
of tackles, the probability of winning is elevated to 55%.
The
dashboard shows the results. The red line depicts the estimated probabilities. If you hover over the purple(ish) diamonds you’ll find the match
details: round date, opponent, and the TCR along with tackles made and attempts.
Defensive Performance and Winning Probability
Let’s get back to the model and predictions based thereon. This time we’ll evaluate the actual performance, not just one variable leaving the other metrics at their averages. When the Saints
completed only 58 tackles out of 92 attempts (Round 12), they had a 11.9% probability to defeat the Harlequins. On the opposing extreme, when the Falcons recorded the season-highest TCR (98.3%),
the winning probability was equal to 80%. Interesting fact: both matches were played on the same day.
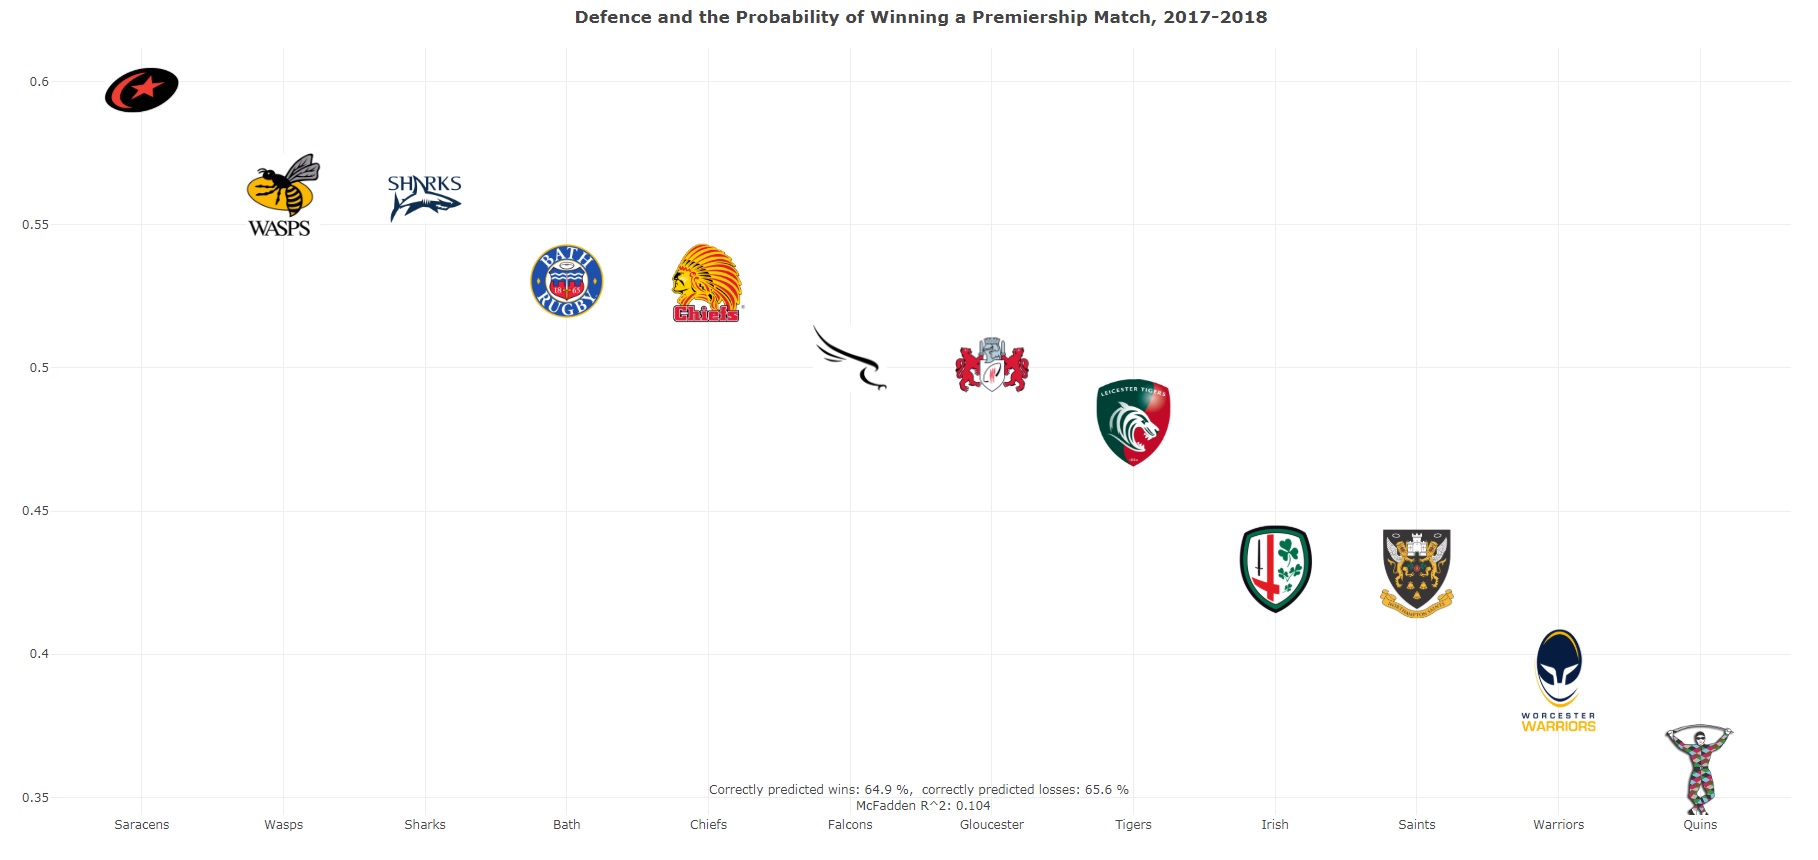
How did the probabilities for the teams look like? The Saracens led the competition with nearly a 60% probability of winning. If you wondered why the Quins, last season’s polar opposite to the
Saracens, appointed a defensive mastermind as their head coach, the 36% probability should resolve any doubt. These two results are by no means surprising. How the Sharks rank, on the other hand,
might be. A closer look at their defensive performance reveals that Sale led the Premiership in TCR (88.5%) and in own defenders beaten per run (0.123; Saracens 0.167). The third largest
probability of winning estimated for the Wasps, who were ranked #1 in turnovers forced per opposition run (0.124; Saracens 0.113). By the way, TOs per opposition carry were also the most influential
factor in the estimated model. But I have a nagging feeling it wasn’t all about the TOs and that the Wasps defence was just underrated.
| Team |
Prob |
TCR |
MT/C |
DB/C |
TO/C |
| Saracens | 59.7% | 84.7% | 2.821 | 0.167 | 0.113 |
| Wasps | 56% | 85.5% | 3.358 | 0.157 | 0.124 |
| Sharks | 55.9% | 88.5% | 2.945 | 0.123 | 0.095 |
| Bath | 53.3% | 86.6% | 3.043 | 0.148 | 0.100 |
| Chiefs | 53% | 84.6% | 3.283 | 0.160 | 0.114 |
| Falcons | 50.3% | 87.8% | 3.338 | 0.131 | 0.101 |
| Gloucester | 50.1% | 85.1% | 3.275 | 0.176 | 0.11 |
| Tigers | 48.1% | 86.4% | 3.417 | 0.161 | 0.107 |
| Irish | 43.0% | 85.1% | 3.962 | 0.170 | 0.121 |
| Saints | 42.8% | 83.5% | 3.42 | 0.187 | 0.102 |
| Warriors | 39.1% | 84.1% | 3.528 | 0.181 | 0.095 |
| Harlequins | 35.9% | 80.7% | 3.995 | 0.187 | 0.112 |
TCR and Winning Probability after Round 2
A vigorous discussion on TCR had ensued after Round 1 and disappeared in the same week. Like most topics related to defence it wasn’t expected to last long. Despite all doubts related
to the small sample bias, I decided to run some estimations anyway. I’ve been experimenting with Bayesian methods (again), so I thought why not give it a try. At least the Bayesian model
could neutralise the small sample bias a little. Below is the diagnostic dashboard. In its centre, I depicted the simulated probabilities. The probability curve (black solid line) is
strikingly similar to the one you’ve already seen. Again, the probabilities do not vary much, ranging between 41% for the worst tackling efficiency and 59% for the best one. If you inspect
the upper-left and upper-right panels of the dashboard, you’ll see that the 0-lines (marked red) are suspiciously close to the median-lines (green dashed-lines). It means that so far, the TCR
has not had a significant impact on the probability of winning. That, however, I expect to change in the nearest future alongside the increasing number of observations. I don’t expect the
impact itself to be much larger than it is now, though.
Dashboard